Making Use of Kubernetes Test Infra Tools
The test team has a great summary page on test infrastructure. This blog just summarizes some of the pages, and as I learn more, will have some notes on the tools.
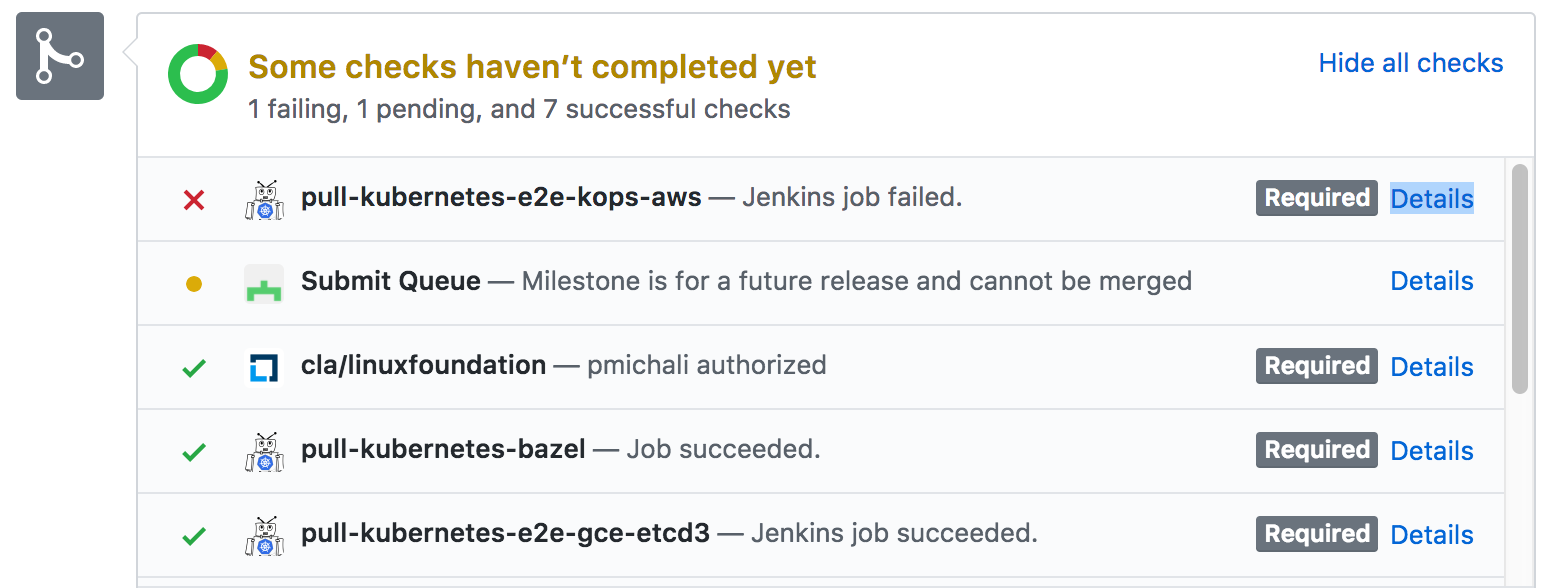
When you submit a Pull Request, there are several tests run, with the results reported in the PR:
Gubernator
If you click on the “Details”, it will take you to the gubernator page with the test results, failures (if any), and logs. You can go the Gubernator home page to see the jobs, where you can click on a job to see the history for a specific test (e.g. ci-kubernetes-build-1.7).
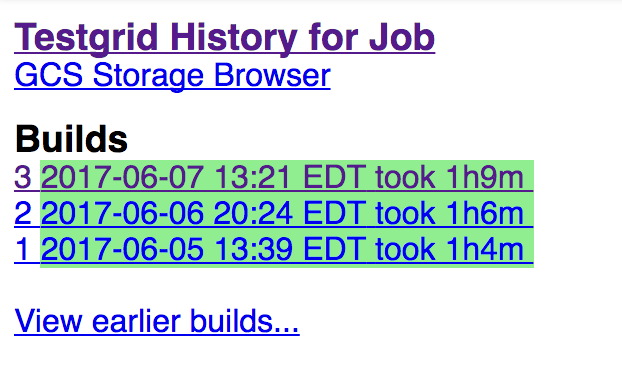
Test Grid
From the job page, there is a link to a detail page for another tool, TestGrid. This tools shows test results over time for jobs. The top level page has links for groups of tests, like “release 1.6 blocking”. From there, you can look at the results for a specific job. For example, you can see the kubelet 1.6 test results for the week, under the release 1.6 blocking tests.
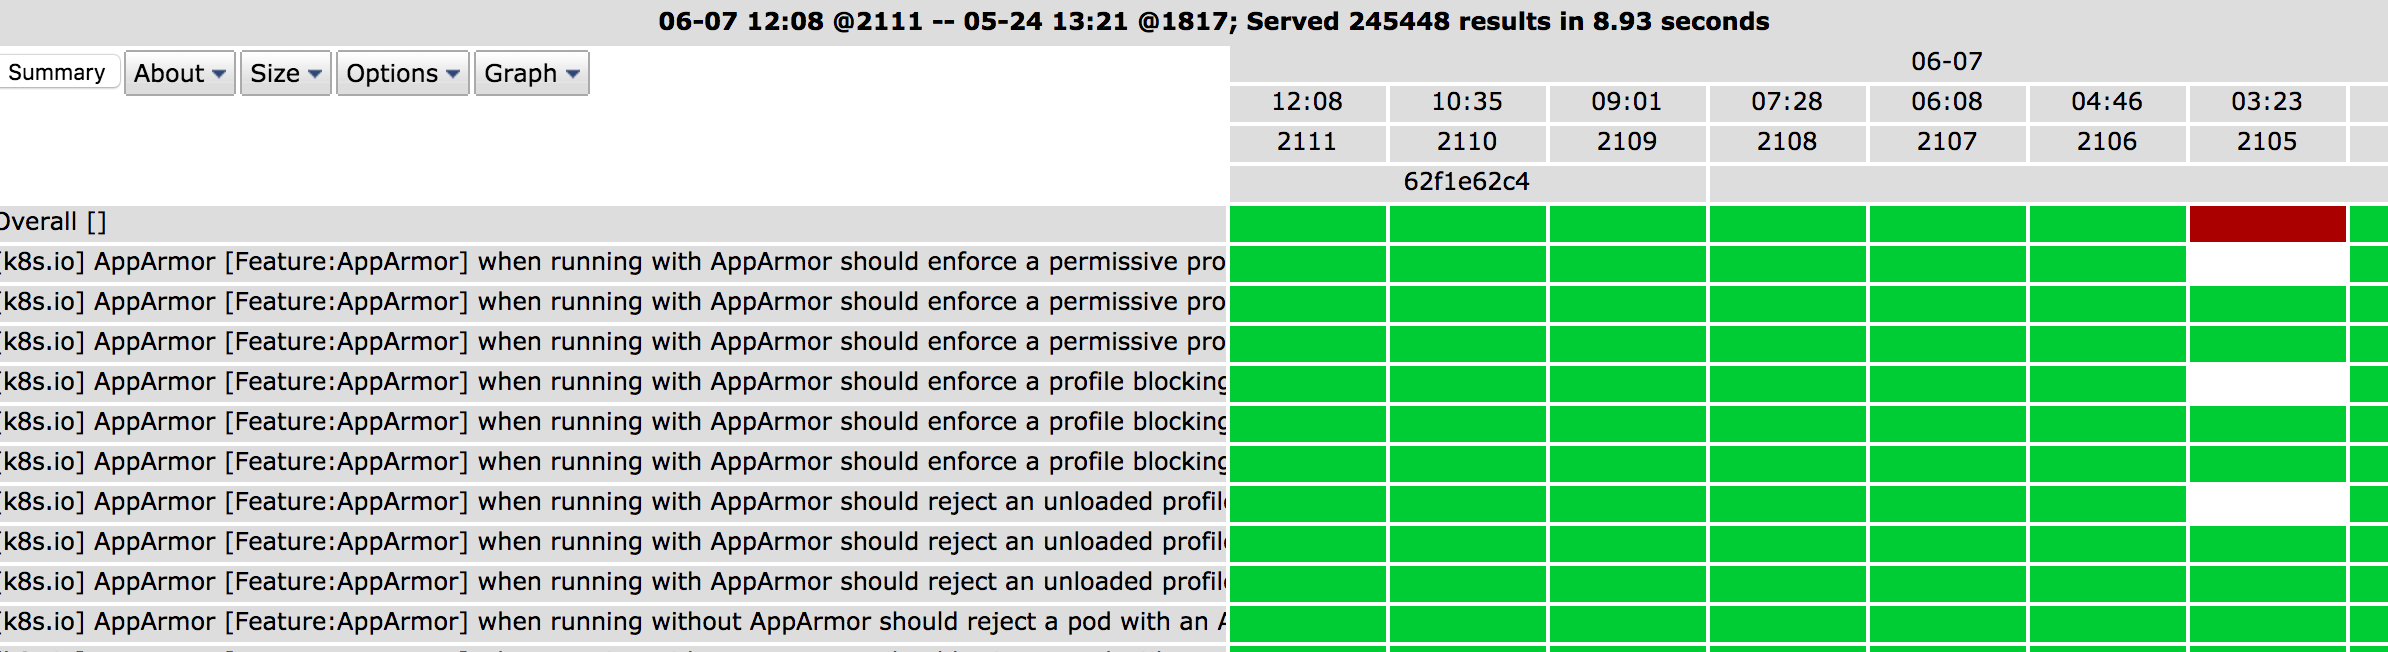
The Summary link is very useful, for a group, as it will show how many tests failed and how many ran, for each test in the group, over the past week.
PR Dashboard
At the Gubernator home page is a link to the Pull Request Dashboard. This will show PRs of interest to you (you’re referenced in some manner). You may see Needs Attention for PRs that need review/approval, Approvable for reviews you could approve (if you have that capability), Incoming for review, and Outgoing for reviews you authored.
You can change the user at the top to see someones dashboard, which can be useful, when looking for reviewers, as you can see their workload.
Prow
The top level test infrastructure tool Prow, shows PRs and jobs for several queues (?). The default is pre-commit, which is triggered to run when comments made on unmerged PRs. Another is the post-submit queue, which is triggered on every merge and/or push to branch. The periodic queue, is one that runs based on a timer (e.g. every 24 hours). There is a batch queue that has several PRs being tested at once.
On the listing you can see the status of the job (check, X, or orange dot for in-progress), PR number(s), job name, start date/time, and duration. Clicking on the PR, takes you there. Clicking on the job, takes you to the test results.
You can do additional filtering (repo, author, job).
Submit Queue
The Submit Queue shows the PRs in queues. There are additional links to see PRs, merge history, and end-to-end test information with some health graphs. The info link shows the rules for how PRs are ordered in the merge queue, merge requirements, bot status, health, and a link to bot commands.
FYI: Erick Fejta gave a great presentation on the test infrastructure (a lot over my head :)). The slides are here.
Velodrome
For those interested in the big picture, there is Velodrome. This has a bunch of graphs with metrics, like merge rate, number of open pull requests, number of comments, number of commenters, etc.
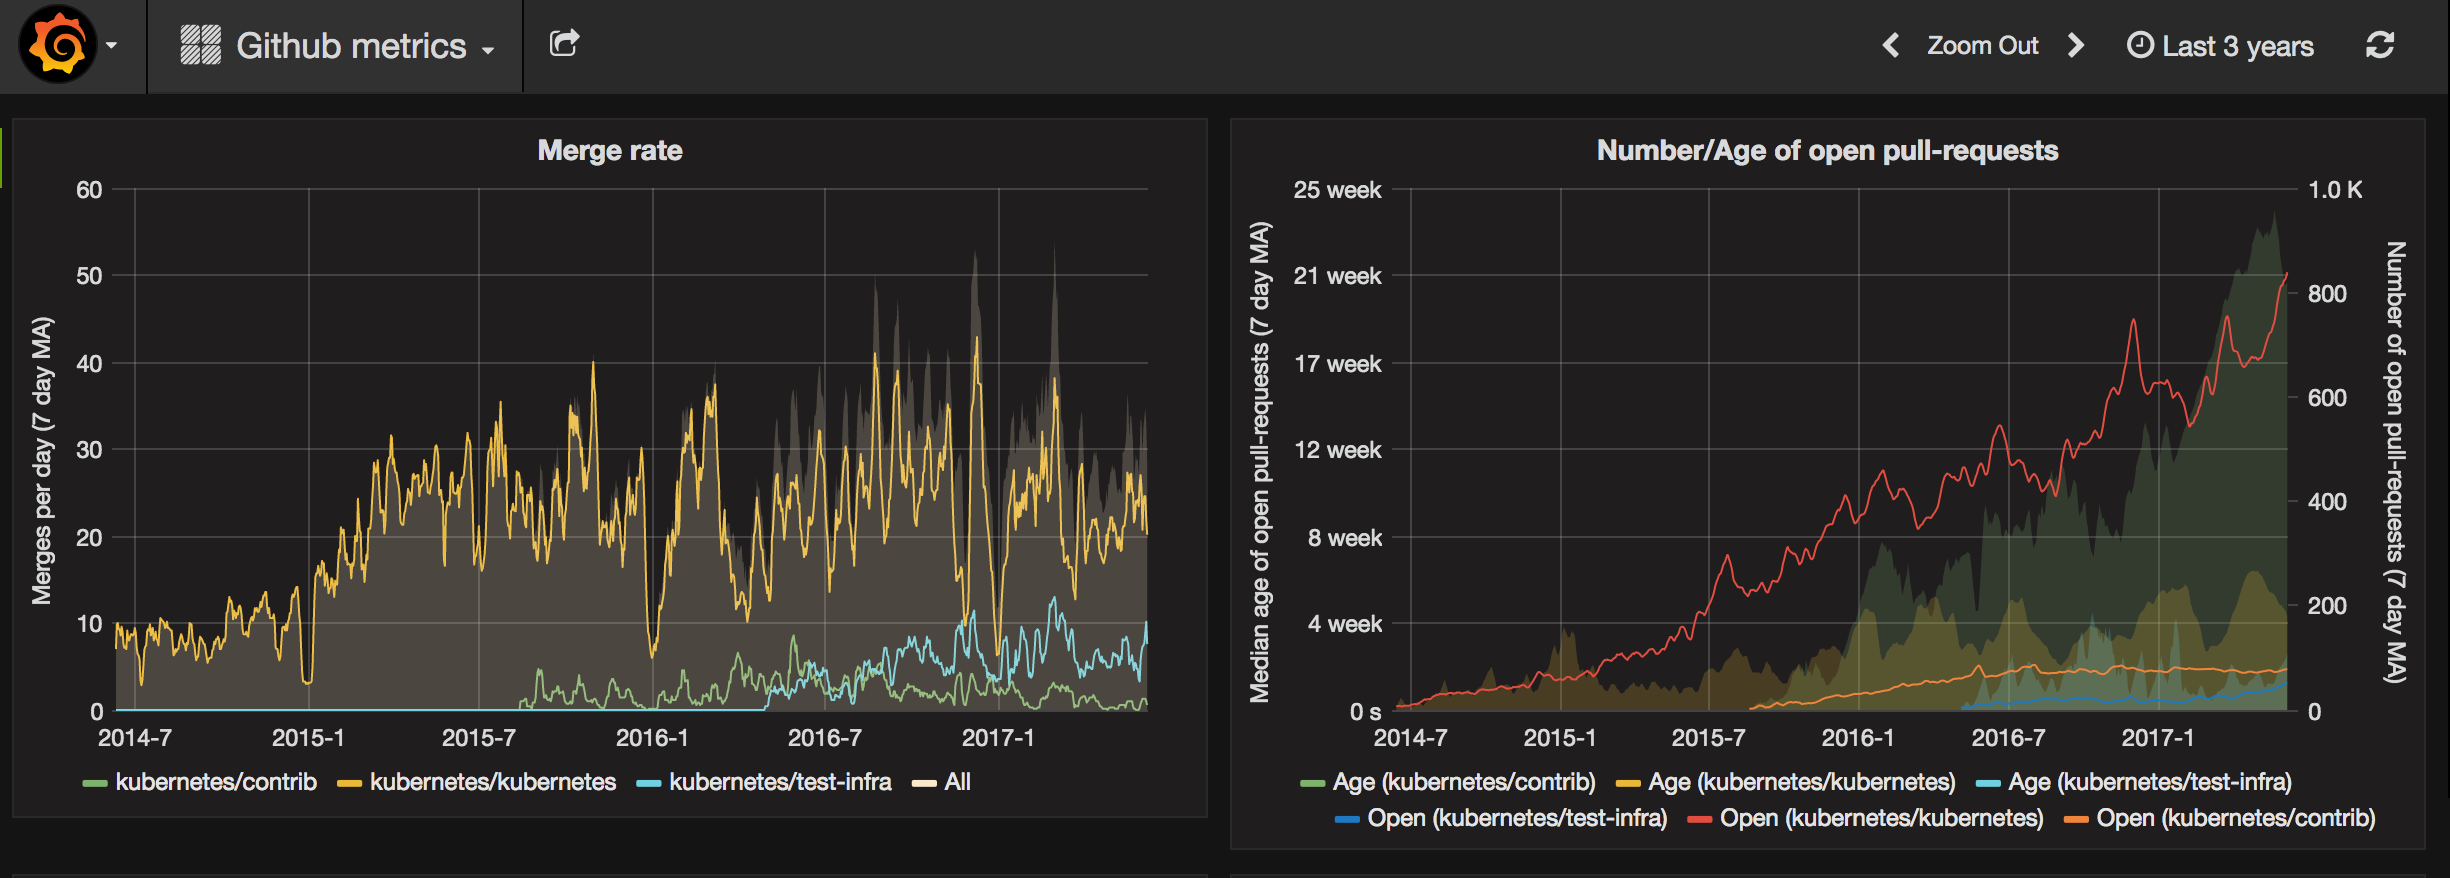
At the top left, there is a pulldown with other metrics besides “Github Metrics”, including developer velocity and monitoring.
Triage Dashboard
If you are wondering a out failures by code area, visit the Triage Dashboard. You can see a graph of failures over time, along with a snippet of the error seen, and the job(s).
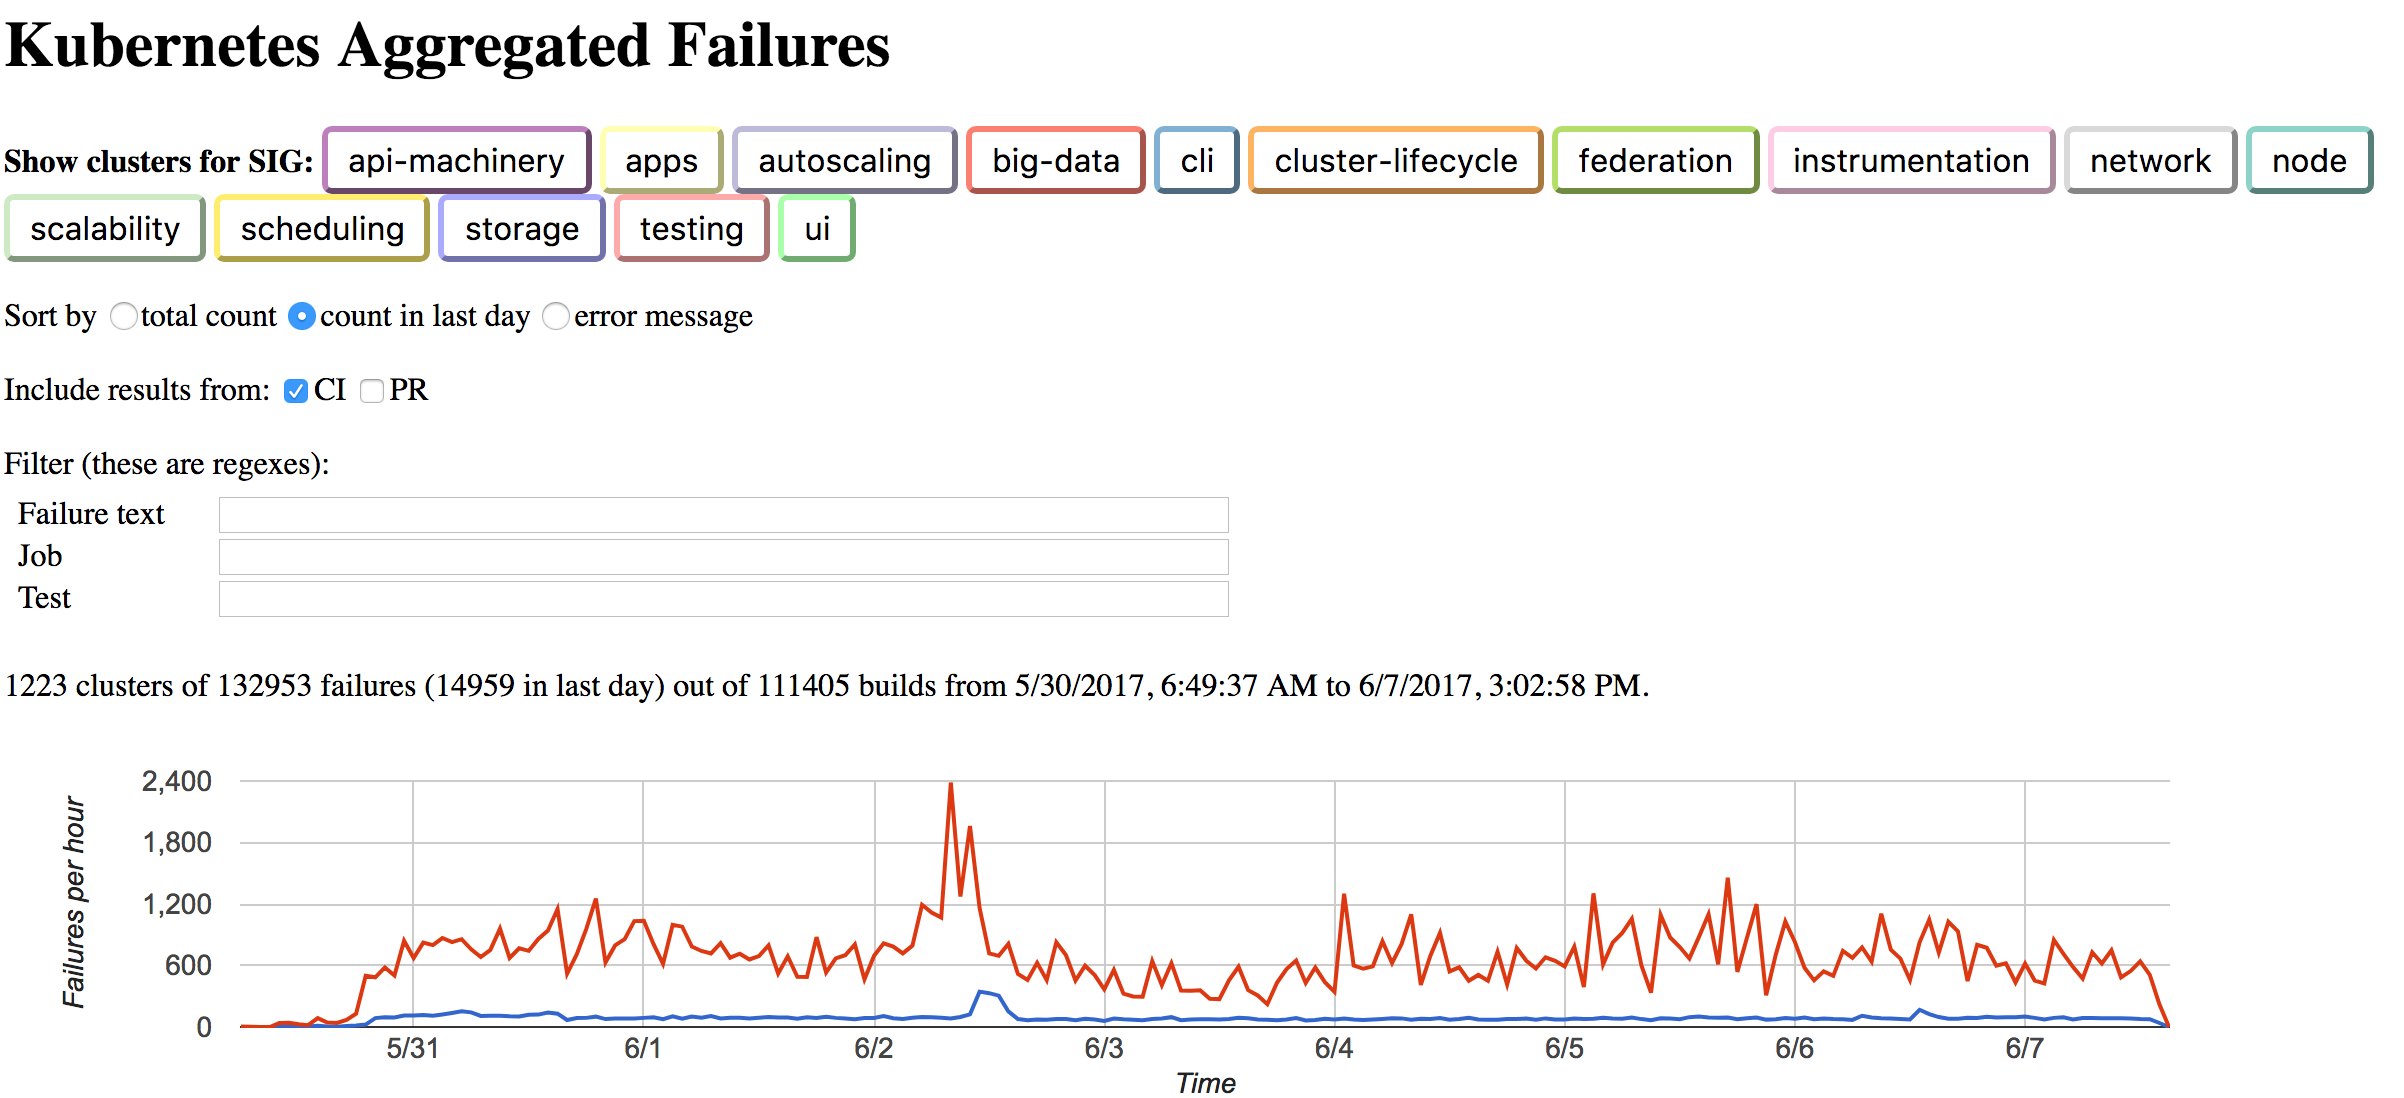
There are bunch of filters that can be applied, including text to search in the failure messages. Afraid I don’t have the secret decoder ring to fully understand this dashboard (yet).
Reference
Erick Fejta did a great recorded presentation at the 6/6/2017 SIG testing meeting on how the test infra currently works (slides). A great explanation of a very complex setup. The tools above are mentioned there.